
It is often said that we live in a ‘knowledge economy’ or ‘knowledge society’. While it is commonly understood that making sense and understanding vast quantities of data is essential to the work of such an economy, the role of representations and visualizations is often understated or ignored. The assumption here is, of course, that they simply communicate data in a more or less neutral way. In “Raw Data is an Oxymoron” (Gitelman 2013), an excellent collection of essays on the imaginaries of data as a ‘natural resource’, Gitelman reminds us that data is always ‘cooked’, that is, it is always in some way processed.
In this short exploration, I will argue that the attention to forms and aesthetics of digital representations can help us understand their mediating role and how they shape conceptions of knowledge. By looking at the example of Powerpoint, I want to draw out the formal and aesthetic properties that are specific to it, see what kind of work Powerpoint accomplishes and how it creates knowledge. We will see that Powerpoints are not mere visual aids to oral presentations but powerful artifacts in their own right.
The Powerpoint software, developed by Microsoft, is familiar to virtually anyone who interacts with personal computers on a regular basis or who is familiar with the modern workplace or educational system. Scholars that have studied the use of Powerpoint in scientific and commercial settings (such as advertising agencies, consulting firms and high-tech companies), have not only highlighted the pervasive use of Powerpoint but also observed that there is almost an inherent expectation to present findings or discussions visually through some “slide-based” digital software. PowerPoint, thus, „is a normative and normalising“ part of many corporate workplaces (Wakeford 2006). In most firms Powerpoint presentations are used more generally to enable both internal and external communication. Interestingly, most discussions of Powerpoint that I have looked at mention, at least at some point, a lot of people’s opposition towards the (mis)use of the Powerpoint software. Commenting on this opposition, media scholars Yates and Orlikowski observe in their visits to offices and workplaces that
“In spite of this opposition, however, project managers continued to use PowerPoint extensively. Because they wished to achieve a consistent look-and-feel to both internal and client presentations, they also insisted that everyone in the firm use PowerPoint and its built-in features.”
One of the things this makes evident is that the Powerpoint software and the way it is enacted creates a very distinctive and often sought-for form of digital (re)presentation. But what is this form?
Composing a Powerpoint presentation
Powerpoint presentations typically consist of a sequence of ‘slides’. The slides’ design is typically predefined by one of the software’s or a firm’s standard templates. Yates and Orlikowski observe a series of what they call ‘form expectations’. While these expectations arise from previous norms, such as the preference for bullet points over complete sentences, that also exists without Powerpoint (for example in bureaucratic documents) and have existed before it (for example in presentations with transparencies), Powerpoint does reinforce these norms in that it institutionalizes them by making them simple to use and insert. Some recurrent features of Powerpoint presetations are graphs, tables, photographs and agenda and title slides that introduce the subsections of the presentation. An important part of working with Powerpoint, thus, is arranging and composing disparate media forms and data sets in a new medium in order to bind them into a single artefact.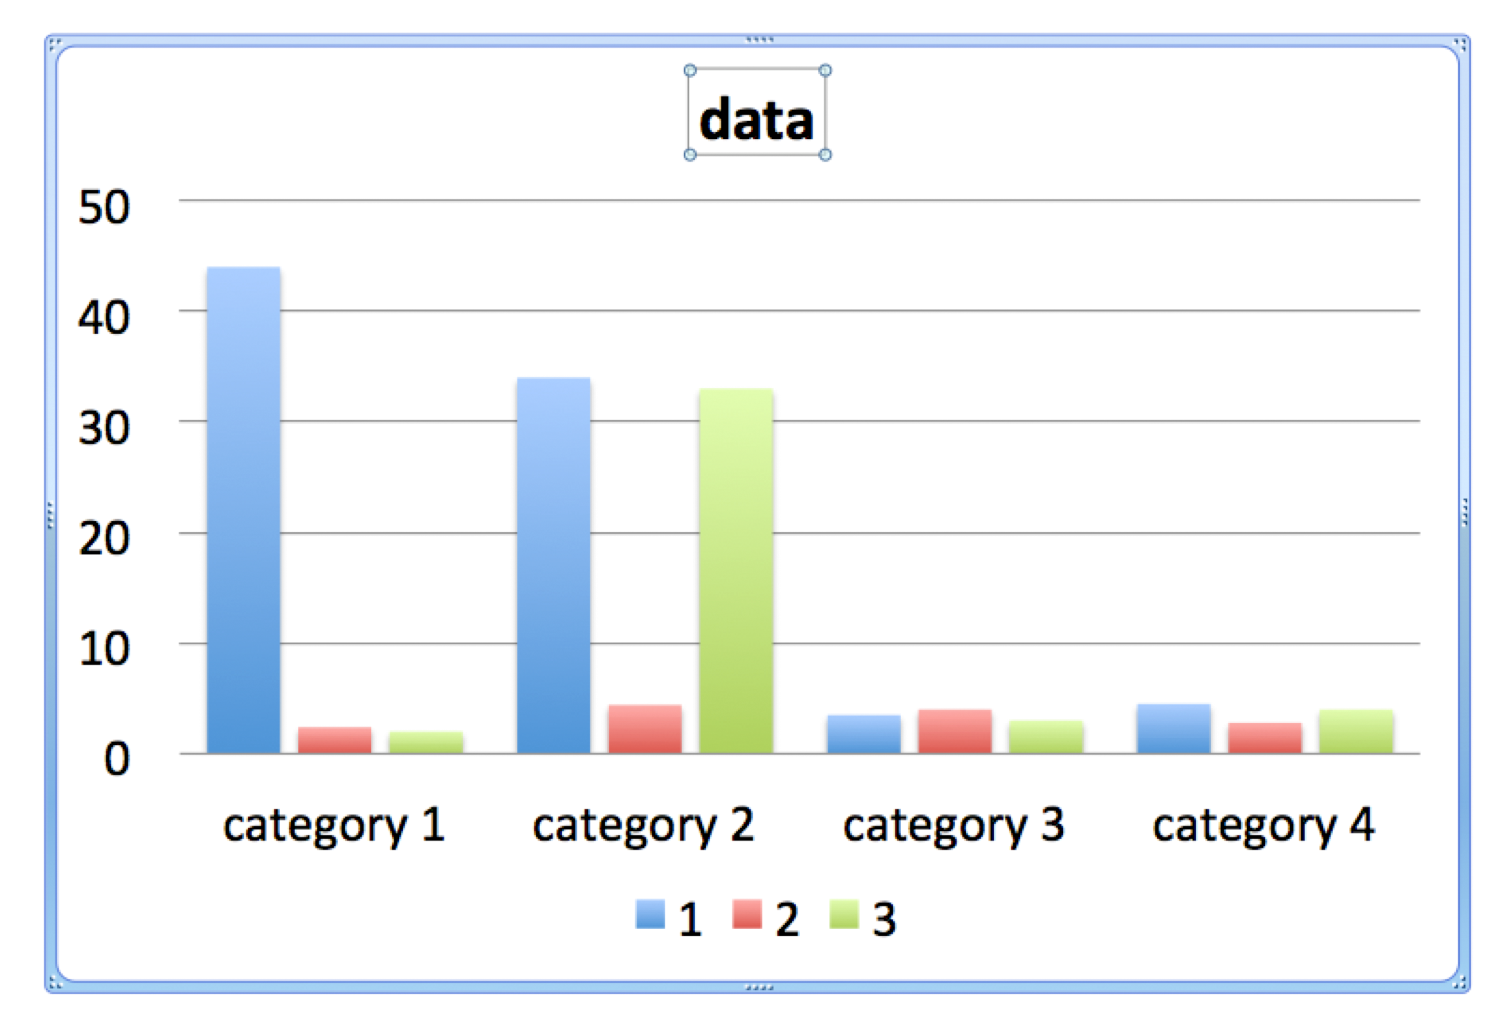
The most distinctive part of a Powerpoint presentation is the bullet point. The property of bullet points might be best described by its lack of such. As anthropologist Strathern has pointed out in her analysis of formal documents, since bullet points are self-contained and each one stands for and by itself, a list of bullet points exhibits no internal relation between its discrete points, unlike a sentence or a text it has no “argumentative structure” and can be rearranged in any order. For Strathern it follows that one cannot critique them or in fact do any intellectual operation on them. They are, thus, mere “bits of information” that can be shuffled and compared.
Distributing a Powerpoint presentation
Importantly, in commercial settings the Powerpoint slides (called “decks”) are in itself often the only final output or “deliverable” that concludes a project, replacing what was once the written report. Thus, in certain contexts where this is the case, the central role of the Powerpoint presentations for the work done in these firms should not be underestimated. I have myself worked in consultancies where this is the case. The creation of a Powerpoint is often central to the work of these firms and involves many people simultaneously. This was in no way typical for older forms of presentations, such as the ones done with transparencies. A common practice in these collaborative works, is copying content from previous presentations and rearranging it for new ones. Whether or not one goes so far as to claim that the software “reinforces the interchangeability of content” (as Crang 2003 claims), it does seem that Powepoint allows for the fencing off, dividing up and easy reshuffling of data. With the Powerpoint presentation, knowledge is generated through the mixing of bits and pieces. The resulting Powerpoint file becomes a powerful artifact of knowledge.
At no point is this more evident than in the emailing, sharing and forwarding of Powerpoint files. Especially when the Powerpoint presentation is no longer primarily a visual aid for an actual presentation, but more an end report, the delivery and distribution of a Powerpoint becomes the concluding step of a project and the file the “real object of value”. As such, it can certainly take on a life of its own when it is no longer in the hands of its creators but sent to others who are not familiar with how the Powerpoint came to be. Here, it is also important to remember, that the elevation of the Powerpoint presentation from a visual aid to an “end report” occurs without many further formal or aesthetic changes and adjustments: it is still mostly a sequence of bullet points and data graphs. The formal qualities of a Powerpoint presentation do, then, also facilitate the disintegration and reassembling of its parts. The crucial point though, is that a Powerpoint is assumed to be transferable and, as Wakeford points out, it is “seen as an objects that can be transmitted without being attached to the context of their production“.
Indeed, if we follow the idea of a ‘knowledge society’ or ‘knowledge economy’ and all its implied assumptions, we start seeing that it is precisely this ease of transmission of data, information and knowledge, facilitated by representational tools such as Powerpoint, that is essential to the functioning of a ‘knowledge economy’. Social anthropologists James Leach, who has worked extensively in the field of digital technologies and knowledge production, has succinctly summarized this contemporary trend:
“[…] there is a commonly observable phenomenon across many contexts in which ‘knowledge’ is produced. It is a move that renders multiple values generated by complex social processes into simple and often commodifiable value located in objects, as if those objects retained their value shorn of the social relations in which they have effect. In other words, knowledge becomes a matter of economy.”
What Powerpoint and many other visualization tools do, then, is help to advance the logic of a ‘knowledge society’ by turning data and information into objects that can be easily transferred and exchanged, much like commodities. And that is precisely why,despite many people’s opposition, the business world continues to make such heavy use and depend so fundamentally on it.